Getting started with ClusterGraph
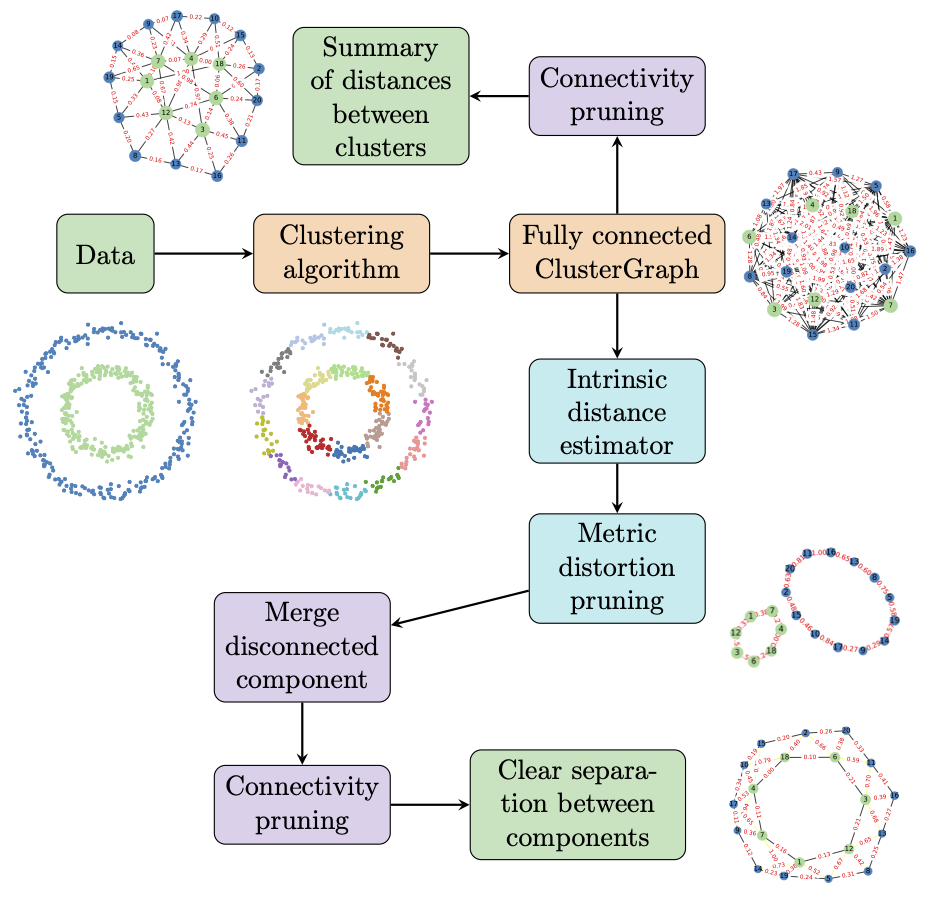
ClusterGraph is a tool which allows the visualization of the geometric organization of clusters.
It consists of a fully connected graph built on the output of a clustering algorithm, applied to a dataset. Each vertex corresponds to a specific cluster. Two vertices are connected by an edge whose length corresponds to the distance between their respective clusters.
Edges that do not contribute to the geometric organization can subsequently be removed, in order to obtain a simpler visualization.
More information can be found the accompagning paper “ClusterGraph: a new tool for visualization and compression of multidimensional data” arXiv:2411.05443.
Install the package 📦
ClusterGraph is avaliable on pypi and can be installed via the following command
pip install clustergraph
Basic usage
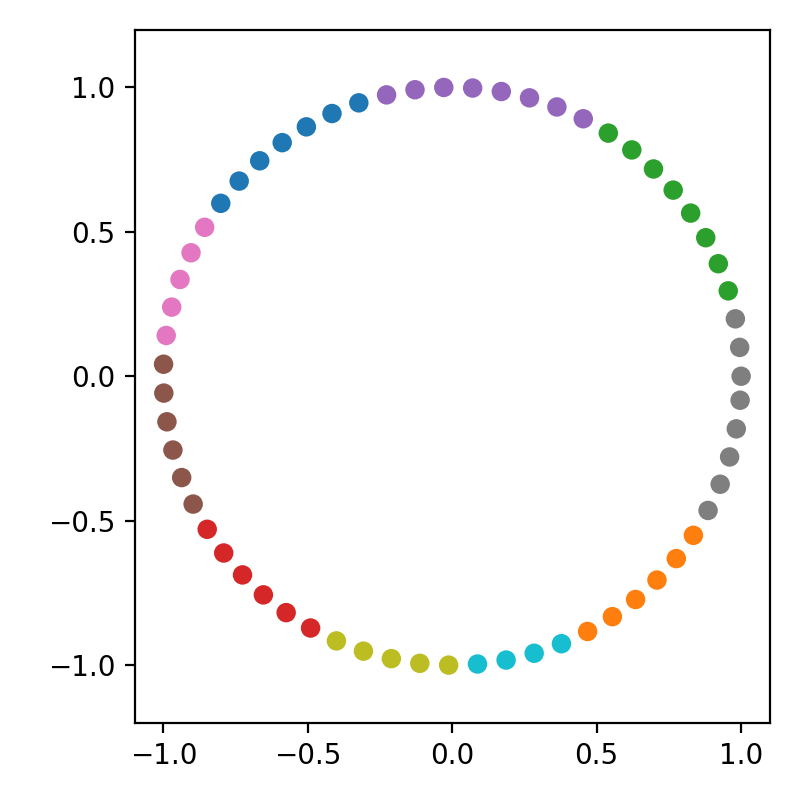
Let X be a dataset, for example points sampled from a circle.
X = np.array([[np.cos(x), np.sin(x)] for x in np.arange(0, 6.3, 0.1)])
We first run a clustering algorithm.
from sklearn.cluster import KMeans

model_KM = KMeans(10, random_state=42)
pred = model_KM.fit_predict(X)
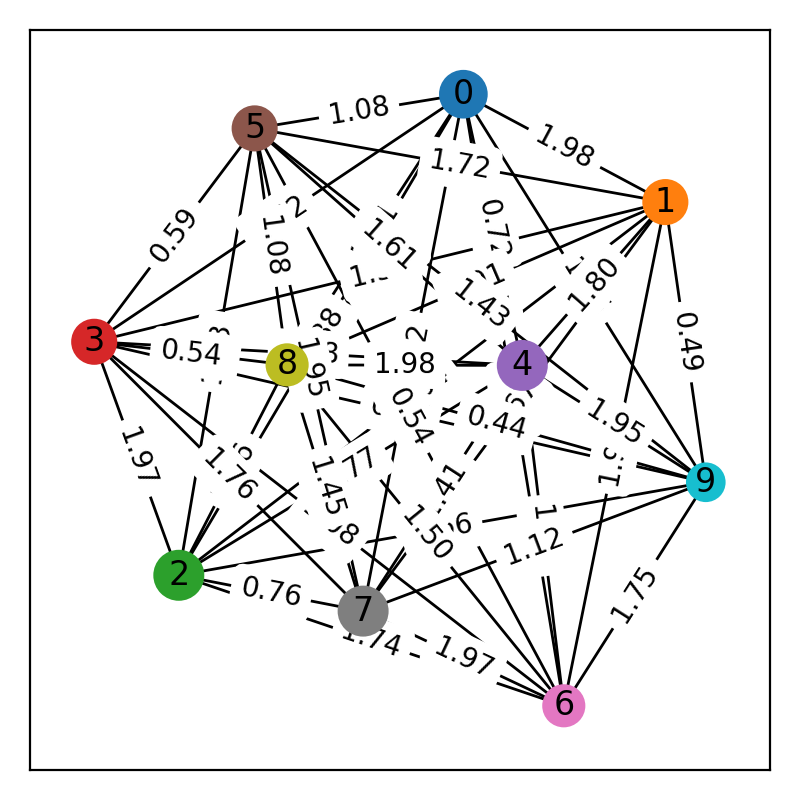
Then we build a ClusterGraph on top of it
import clustergraph.clustergraph as cg
from clustergraph.utils import get_clusters_from_scikit
from clustergraph.plot_graph import draw_graph

cluster_g = cg.ClusterGraph(
    clusters=get_clusters_from_scikit(pred),
    X=X,
    metric_clusters="average"
)

# Coloring the graph
cluster_g.color_graph(
    node_color_labels=pred,
    node_palette=cm.get_cmap("tab10"),
)

fig, ax = plt.subplots(figsize=(4, 4))
draw_graph(cluster_g.Graph, ax=ax)
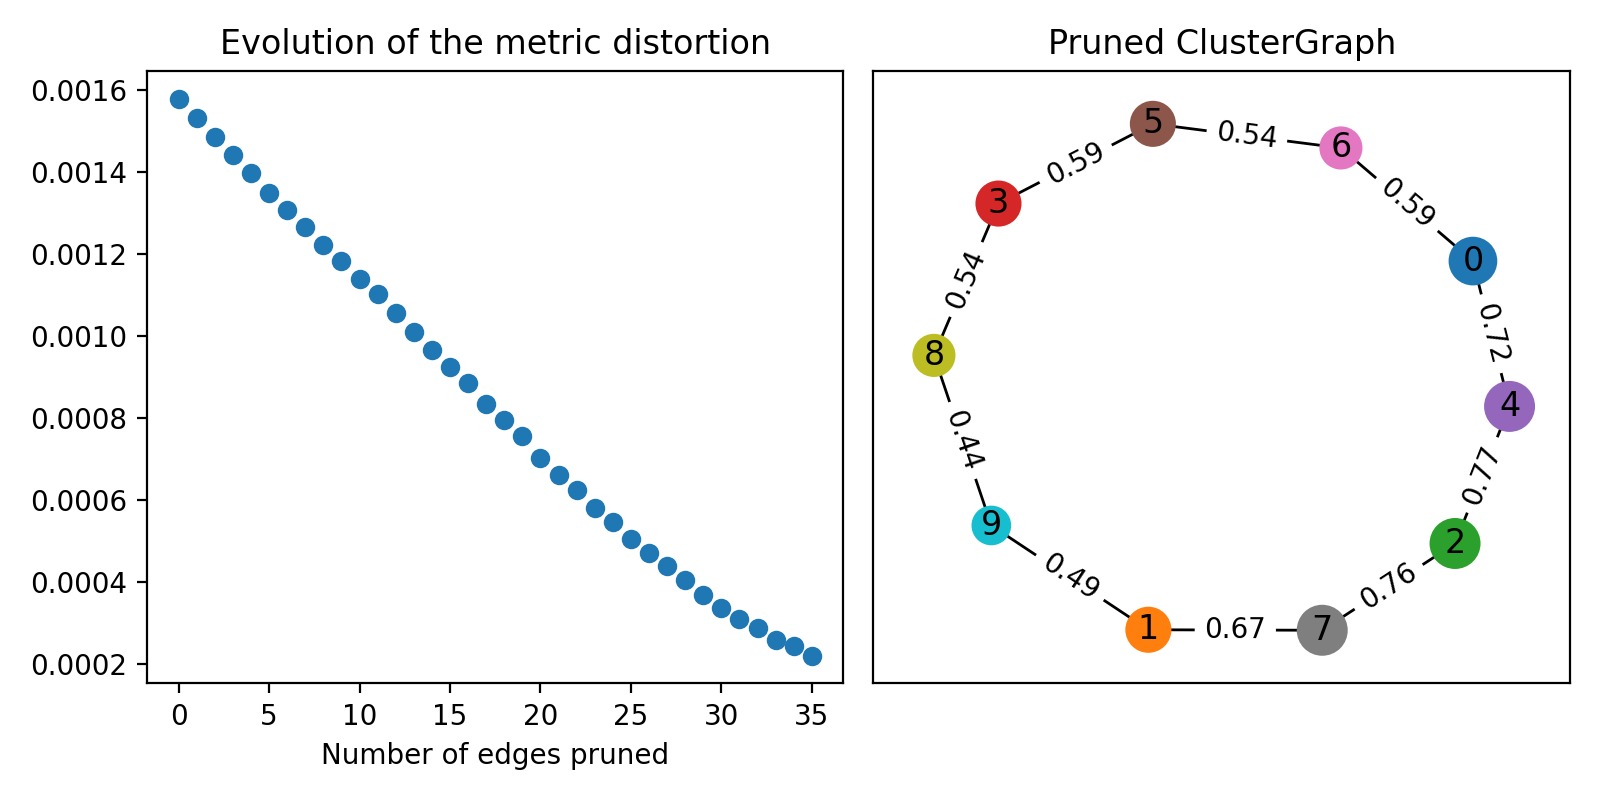
metric_distortion_graph, md = cluster_g.prune_distortion(knn_g=5, score=True)

fig, (ax1, ax2) = plt.subplots(ncols=2, figsize=(8, 4))

ax1.scatter(range(len(md)), md)
ax1.set_title("Evolution of the metric distortion")
ax1.set_xlabel("Number of edges pruned")

ax2.set_title("Pruned ClusterGraph")
metric_distortion_graph = cluster_g.prune_distortion()
draw_graph(metric_distortion_graph, ax=ax2)
For more examples, check out the example notebooks or the documentation.
References
If you find this package useful please cite
Dłotko, P., Gurnari, D., Hallier, M., & Jurek-Loughrey, A. (2024). "ClusterGraph: a new tool for visualization and compression of multidimensional data". arXiv preprint arXiv:2411.05443.